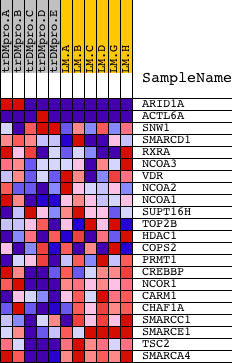
Profile of the Running ES Score & Positions of GeneSet Members on the Rank Ordered List
| Dataset | Set_04_transDMproB_versus_LMproB.phenotype_transDMproB_versus_LMproB.cls #transDMproB_versus_LMproB |
| Phenotype | phenotype_transDMproB_versus_LMproB.cls#transDMproB_versus_LMproB |
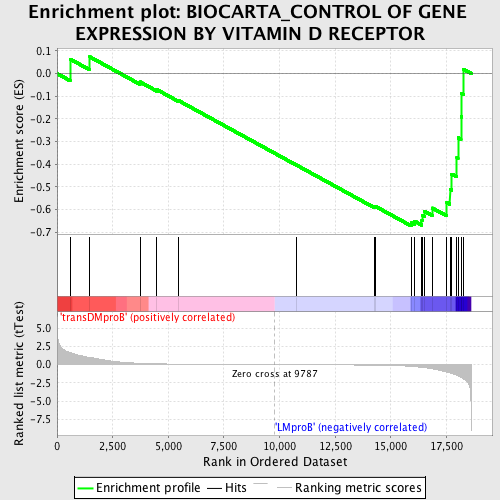
| Upregulated in class | LMproB |
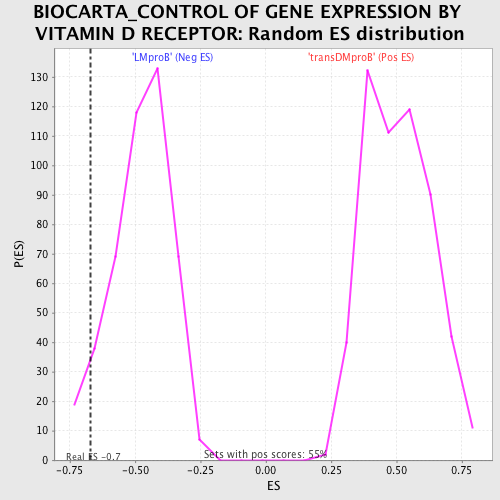
| GeneSet | BIOCARTA_CONTROL OF GENE EXPRESSION BY VITAMIN D RECEPTOR |
| Enrichment Score (ES) | -0.6722247 |
| Normalized Enrichment Score (NES) | -1.4078811 |
| Nominal p-value | 0.050772626 |
| FDR q-value | 1.0 |
| FWER p-Value | 1.0 |
| PROBE | DESCRIPTION (from dataset) | GENE SYMBOL | GENE_TITLE | RANK IN GENE LIST | RANK METRIC SCORE | RUNNING ES | CORE ENRICHMENT | |
|---|---|---|---|---|---|---|---|---|
| 1 | ARID1A | 8214 2501 13554 | 586 | 1.633 | 0.0639 | No | ||
| 2 | ACTL6A | 12136 13068 16662 3457 3554 | 1470 | 0.984 | 0.0739 | No | ||
| 3 | SNW1 | 7282 | 3728 | 0.185 | -0.0367 | No | ||
| 4 | SMARCD1 | 2241 22360 2250 | 4486 | 0.112 | -0.0709 | No | ||
| 5 | RXRA | 9767 | 5468 | 0.069 | -0.1196 | No | ||
| 6 | NCOA3 | 5156 | 10765 | -0.010 | -0.4038 | No | ||
| 7 | VDR | 5852 10285 | 14263 | -0.073 | -0.5876 | No | ||
| 8 | NCOA2 | 5155 4034 | 14315 | -0.074 | -0.5860 | No | ||
| 9 | NCOA1 | 5154 | 15919 | -0.233 | -0.6586 | Yes | ||
| 10 | SUPT16H | 8541 | 16057 | -0.266 | -0.6504 | Yes | ||
| 11 | TOP2B | 5791 | 16394 | -0.367 | -0.6470 | Yes | ||
| 12 | HDAC1 | 9081 | 16410 | -0.374 | -0.6259 | Yes | ||
| 13 | COPS2 | 4551 | 16516 | -0.411 | -0.6075 | Yes | ||
| 14 | PRMT1 | 9121 | 16860 | -0.566 | -0.5929 | Yes | ||
| 15 | CREBBP | 22682 8783 | 17516 | -1.011 | -0.5690 | Yes | ||
| 16 | NCOR1 | 5402 | 17659 | -1.136 | -0.5103 | Yes | ||
| 17 | CARM1 | 19539 | 17736 | -1.217 | -0.4433 | Yes | ||
| 18 | CHAF1A | 23188 | 17969 | -1.466 | -0.3701 | Yes | ||
| 19 | SMARCC1 | 9834 5459 | 18022 | -1.544 | -0.2827 | Yes | ||
| 20 | SMARCE1 | 1218 20253 | 18156 | -1.704 | -0.1903 | Yes | ||
| 21 | TSC2 | 23090 | 18185 | -1.757 | -0.0891 | Yes | ||
| 22 | SMARCA4 | 19538 | 18261 | -1.921 | 0.0191 | Yes |